Toronto, Ontario – September 27, 2023 – Canadian Gold Corp. (TSXV: CGC) (“Canadian Gold” or the “Company”) is pleased to announce additional drill results from its Phase 1 Exploration Program at the Tartan Mine, located near Flin Flon, Manitoba, which builds on the earlier drill holes that are targeting resource growth at depth (click here August 23, 2023 news release). The results to date indicate the potential for a larger discovery below the current resource estimate, which remains open for meaningful expansion. The Company is also providing an update on its regional field work at the Tartan Mine, where high-grade gold samples have been identified approximately 1.4 kilometres (km) from the mine, with the goal of discovering a third zone close to the existing infrastructure, and an update on its engineering review, specifically around the process plant design and potential mine reopening.
“Phase 1 drilling at the Tartan Mine has extended the vertical limits of the high-grade gold mineralization well beyond our expectations. Between our exploration success and engineering advancements, we are potentially seeing the restart of a profitable mining operation. We also feel it’s possible to better target the high-grade now that we have an understanding of the rock conditions at depth. We will do this by using directional drilling going forward. Our Phase 2 drill program will look to 1) materially expand the limits of the known mineralization once again in order to determine if the new intercepts represent a significant discovery at depth and 2) better define the high-grade zones, particularly in the Hanging Wall (“HWZ”). We have a drill onsite and expect to commence Phase 2 drilling very shortly,” stated Ian Ball, Interim CEO & President.
Exploration Drilling Tartan Mine
Zone Continues to Widen at Depth with High-Grade Core
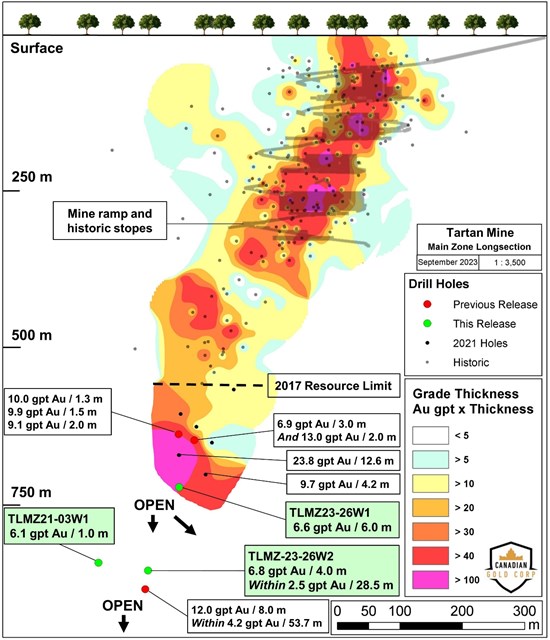
Drill results 40 metres above the recent wide interval at depth (Hole TLMZ23-26 4.2 gpt gold over 53.7 metres, including 12.0 gpt gold over 8.0 metres) that materially expanded the limits of the gold mineralization by 325 metres vertically, compared to the current resource estimate (Fig. 1), confirmed that the Main Zone is widening below 800 metres, while containing a higher-grade core, returning 6.8 gpt over 4.0 metres within 2.5 gpt gold over 28.5 metres. The results also demonstrate that the Main Zone is no longer plunging steeply to the northwest as predicted, but is becoming vertical (Fig. 1). This new understanding will help the geological team better target extensions at depth during Phase 2.
Drilling 50 metres west of hole TLMZ21-01 (9.7 gpt gold over 4.2 metres completed in 2021) successfully expanded the Main Zone in that direction, returning 6.6 gpt gold over 6.0 metres. This hole is approximately 160 metres below the current limits of the resource estimate (Fig. 1) and returned grades higher than the current estimate over better widths, helping build confidence around the continuity of gold mineralization for future mine planning purposes. This hole was originally intended to expand the high-grade in hole TLMZ21-12 (23.8 gpt gold over 12.6 metres, including 47.6 gpt gold over 5.8 metres completed in 2021), but due to excess deviation while drilling, the ultimate target area had to be changed. The Company intends to correct deviation issues during Phase 2 by using directional drilling equipment that is able to better target the intended area.
The Company is currently planning for its Phase 2 drill program, which is scheduled to start shortly. With aid of directional drilling, the Company will initially target extensions of the known high-grade and disseminated gold mineralization below and adjacent to holes TLMZ21-12 and TLMZ23-26 discussed above (Fig. 1). This drilling will continue to test the limits of the orebody in order to establish the overall size of the Main Zone for potential mine planning purposes.
Tartan Mine Regional Exploration
High Priority Area Identified 1.4 KM From Underground Infrastructure
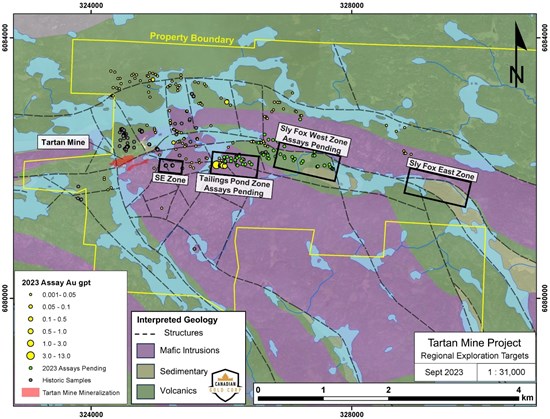
Field work near the Tartan Mine has identified multiple zones of mineralization on surface with new assays up to 13.0 gpt gold(Fig. 2). The focus to date has been around the mine area in order to potentially utilize the underground infrastructure (which would lower start-up costs) should a new discovery be made. The high-grade sample taken at the Tailings Pond Zone (TPZ) is located 1.4 km from the Tartan Mine. The TPZ occurs 900 metres east and along the same structure as the Southeast Zone, with surface samples up to 6.2 gpt gold. Also of importance is the newly discovered Sly Fox West Zone, occurring 3 km west of the Tartan Mine. At this location a shear zone with semi-massive sulphide was identified along the same structure that hosts the Tartan Mine. The zone has been traced over 400 metres along strike and appears to range from 4 to 10 metres in thickness. Regional fieldwork is ongoing, and exploration is planned along both structures further east where they remain open. There are currently 78 samples pending.
Development Update – Gold Recovery Test Work Review
Objective: Increase Gold Recoveries, Lower Costs and Risks
The Tartan Mine benefits from good road access, renewable electric power that comes to site, and significant underground infrastructure. During the past six months, the Company has been reviewing the original process plant design and potential alternatives in order to maximize gold recoveries, and reduce operating costs and technical risks. During the 3 years that the mine operated, gold recoveries averaged 76.4%. An average of 85% gold recovery was achieved during the final year of production with some months being greater than 90%. It is the Company’s belief that new, simplified mill design (crushing, grinding, gravity concentration followed by whole ore leaching), should be able to increase recoveries to low-mid 90%, while decreasing the cost per ounce and lowering the technical risk based on grind sizes that are considered coarse (300 and 150 um K80 primary grind). The Company intends to do further testing using this simplified design to see if the projected gold recoveries can be further increased using a finer grind size, likely feasible due the low electricity costs within Manitoba. The Company will also be evaluating the permitting requirements in order to switch process plant designs and to undertake underwater drone mapping to determine the condition of the underground infrastructure. This will help the Company estimate potential costs associated with dewatering and refurbishing for potential development.
Table 1. Drill Highlights Below 2017 Resource Estimate (525 Metre Limit)
| Drill Hole | From (metres) |
To (metres) |
Interval (metres) |
Grade (gpt) |
Depth Below Surface (metres) |
Zone |
| TLMZ21-01 | 814.8 | 819.0 | 4.2 | 9.7 | 700 | MZ |
| TLMZ21-12 | 769.0 | 781.6 | 12.6 | 23.8 | 670 | HWZ |
| Including | 770.9 | 776.7 | 5.8 | 47.6 | ||
| TLMZ23-26 | 1,007.0 | 1,020.0 | 13.0 | 6.9 | 890 | HWZ |
| And | 1,034.0 | 1,042.0 | 8.0 | 12.0 | MZ | |
| Within | 1,003.3 | 1,057.0 | 53.7 | 4.2 | ||
| TLMZ23-26W2 | 977.0 | 981.0 | 4.0 | 6.8 | 850 | MZ |
| Within | 969.0 | 997.5 | 28.5 | 2.5 | ||
| TLMZ21-12W2 | 736.9 | 739.9 | 3.0 | 6.9 | 650 | HWZ |
| And | 761.0 | 763.0 | 2.0 | 13.0 | MZ | |
| TLMZ23-26W1 | 886 | 892 | 6.0 | 6.6 | 720 | MZ |
| TLMZ21-12W1 | 733.5 | 734.8 | 1.3 | 10.0 | 640 | HWZ |
| And | 745.9 | 747.3 | 1.5 | 9.9 | HWZ | |
| And | 749.5 | 752.4 | 2.9 | 5.0 | HWZ | |
| And | 780.2 | 782.2 | 2.0 | 5.0 | MZ | |
| And | 785.0 | 787.0 | 2.0 | 9.1 | MZ | |
*Interval widths reported; true widths of the system are not yet known due to lack of drilling.
**HWZ = Hanging Wall Zone, MZ = Main Zone.
Table 2. Details of drill holes reported in this press release.
| Drill Hole | Azimuth (Degrees) |
Dip (Degrees) |
Length (metres) |
Easting (UTM) |
Northing (UTM ) |
| TLMZ23-26W1 | 216 | -65 | 923 | 324486 | 6082484 |
| TLMZ23-26W2 | 216 | -65 | 1088 | 324486 | 6082484 |
| TLMZ21-03W1 | 224 | -65 | 1028 | 324449 | 6082401 |
For Further Information, Please Contact:
Ian Ball
Interim President & CEO
Canadian Gold Corp.
(416) 904-2714
info@canadiangoldcorp.com
Qualified Person
The scientific and technical information disclosed in this news release was reviewed and approved by Wesley Whymark, P. Geo., Consulting Geologist for the company, and a Qualified Person as defined under National Instrument 43-101.
Technical Information
The samples collected by Canadian Gold Corp described in this news release were transported in secure sealed bags for preparation and assay by Act Labs in Thunder Bay, Ontario. The samples reported were crushed in their entirety to 80% passing -10 mesh, with one 500 g subsample split and pulverized to 95% passing 150 mesh. One 50 g aliquot was taken from the subsample for fire assay (FA) with an AAS finish. Samples over 5 g/t gold were subject to a 50 g aliquot FA with gravimetric finish. Samples containing visible gold were subject to 1 kg metallic screen analysis with a FA gravimetric finish.
About Canadian Gold Corp.
Canadian Gold Corp. is a Toronto-based mineral exploration and development company whose objective is to expand the high-grade gold resource at the past producing Tartan Mine, located in Flin Flon, Manitoba. The Company holds a 100% interest in greenfields exploration properties in Ontario and Quebec adjacent to some of Canada’s largest gold mines and development projects, specifically, the Canadian Malartic Mine (QC), the Hemlo Mine (ON) and Hammond Reef Project (ON). The Company is 37.6% owned by Robert McEwen, who was the founder and CEO of Goldcorp and is Chairman and CEO of McEwen Mining.
CAUTION REGARDING FORWARD-LOOKING INFORMATION
This news release of Company contains statements that constitute “forward-looking statements.” Such forward-looking statements involve known and unknown risks, uncertainties and other factors that may cause Canadian Gold’s actual results, performance or achievements, or developments in the industry to differ materially from the anticipated results, performance or achievements expressed or implied by such forward-looking statements.
Figure 1. Tartan Mine Longitudinal Section Map
To view an enhanced version of this graphic, please visit:
https://images.newsfilecorp.com/files/3276/181991_a8fbbc10b4deeae6_002full.jpg

Figure 2. Tartan Mine Regional Sampling Plan Map
To view an enhanced version of this graphic, please visit:
https://images.newsfilecorp.com/files/3276/181991_a8fbbc10b4deeae6_003full.jpg

